Geography
Question trying to address in this section
How is the forest fire distributed in the park?
Where in the park has the most severe fire?
Crude variables involved in this section
- X - x-axis spatial coordinate within the Montesinho park map: 1 to 9
- Y - y-axis spatial coordinate within the Montesinho park map: 2 to 9
- area - the burned area of the forest (in ha): 0.00 to 1090.84
Geography plot
geo_1 =
  fire_df %>%
  select(X, Y, area) %>%
  group_by(X, Y) %>%
  mutate(total = sum(area)) %>%
  select(-area) %>%
  distinct() %>%
  ungroup()

geo_2 =
  expand.grid(
    X = unique(pull(geo_1, X)),
    Y = unique(pull(geo_1, X))
  )

geo_3 =
  merge(
    geo_2, geo_1, all = TRUE
  ) %>%
  arrange(Y, X) %>%
  mutate(
    Y = -Y
  )

geo_3[is.na(geo_3)] <- 0

map_image = png::readPNG("./picture/map.png")

map_image_g = grid::rasterGrob(map_image, width = unit(0.89,"npc"), height = unit(0.89,"npc"))

overlap =
  ggplot(geo_3, aes(X, Y, fill = total)) +
  annotation_custom(map_image_g) +
  geom_tile() +
  theme_void() +
  theme(aspect.ratio = nrow(map_image)/ncol(map_image)) +
  scale_fill_gradient(low = "transparent", high = "red")

overlap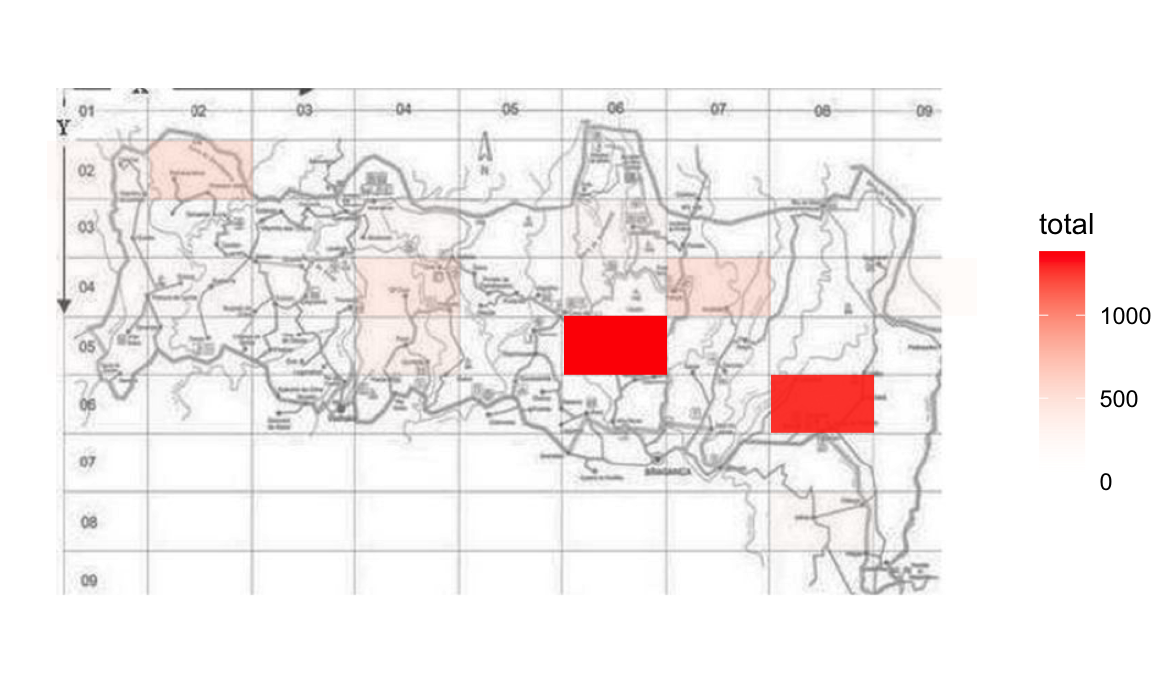
Description on plot
- From the website, we got the map of Montesinho Natural Park with axes.
- If variables
XandYspecify the precise coordinates, scatterplot could show forest fire as dots on the map. - However, variables
XandYspecify the grids on map. Consequently, heatmap is used to show severity of fire within each grid. - We created a new variable
total, which represents “total burned area of fire within each grid”. - Heatmap visualizes variable
totalin the corresponding grid by color. Transparent meansNAor0. Red represents upper limit of variabletotal.